
By IMTFI researchers Sonia Laguna, Rosa Guerrero and Maria Elisa Balen

We realized that the practice of encouraging
participants to have another go and include the adaptations they saw fit was
quite productive. One woman, for example, devised a convention to distinguish
formal unions from informal ones or those that were no longer operating. She used
a crisscrossed double line (similar to this: ₩₩₩ ) to include another woman her
husband had lived with during a period in which they were separated and from
which he had other sons, and she used it to include the father of one of her
grandchildren who never assumed his responsibility. Others came up with
diverse solutions: participant ‘A’ organized different types of
relationships in different sections of the map (siblings in the bottom left,
nieces and nephews in the bottom right, children in the upper left) to
allow for her friends to have a space in the upper right, whilst participant
‘B’ drew her connections towards different family units that were themselves
organized around the woman in each family (her mother, her late husband’s
mother, and her current husband’s mother).
 Our lesson was that, on the one hand, it was important for the
participants to have many attempts, as it gave them the chance to ‘polish’ their
work between drafts, just as researchers do. Additionally, this allowed for the
sequence of attempts to be used as a resource: why does an estranged husband
appear in the second, but not first attempt? Why do some members appear in more
central positions in one draft compared to another? Such questions ended up
being engines for further discussion. Rather than impose a correct way of doing
things, giving participants leeway to adapt allowed for a more creative and
richer grasp of their own worldviews. Such
adaptations allowed for differences among the maps, instead of the
homogeneity of results one would get using a computer program for this
procedure.
Our lesson was that, on the one hand, it was important for the
participants to have many attempts, as it gave them the chance to ‘polish’ their
work between drafts, just as researchers do. Additionally, this allowed for the
sequence of attempts to be used as a resource: why does an estranged husband
appear in the second, but not first attempt? Why do some members appear in more
central positions in one draft compared to another? Such questions ended up
being engines for further discussion. Rather than impose a correct way of doing
things, giving participants leeway to adapt allowed for a more creative and
richer grasp of their own worldviews. Such
adaptations allowed for differences among the maps, instead of the
homogeneity of results one would get using a computer program for this
procedure.
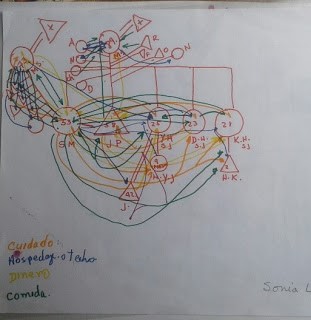
 We began by ascribing different colors to the
different sorts of goods and services flowing through the network: yellow for
food, red for housing, green for money, dark blue for care and light blue for
advice. To this we added an extra color (orange) to be used if the participant
wanted to draw another flow that was not included in the ones we presented. Not
all used it, but this extra provision turned out to be interesting. One
participant chose to draw ‘union’ which for her denoted joint participation in
festivities or everyday recreation and hanging out, while another drew ‘yahé’ — the traditional indigenous medicine through which he communicated and took care of
his daughters. This signaled to us other sorts of interactions that pertained
to wellbeing and a good life while highlighting that the components of such
rituals and interactions were quite diverse.
We began by ascribing different colors to the
different sorts of goods and services flowing through the network: yellow for
food, red for housing, green for money, dark blue for care and light blue for
advice. To this we added an extra color (orange) to be used if the participant
wanted to draw another flow that was not included in the ones we presented. Not
all used it, but this extra provision turned out to be interesting. One
participant chose to draw ‘union’ which for her denoted joint participation in
festivities or everyday recreation and hanging out, while another drew ‘yahé’ — the traditional indigenous medicine through which he communicated and took care of
his daughters. This signaled to us other sorts of interactions that pertained
to wellbeing and a good life while highlighting that the components of such
rituals and interactions were quite diverse.
Fortunately, we had the opportunity to try again. Instead of drawing all the flows on
a single sheet of paper, we used acetate sheets in order to be able to
juxtapose layers. Adding and extracting layers gave us considerable room to
play with. And it allowed for this to happen on site, with the combination of
different layers becoming a resource for discussions with participants. In the
end, there were iterative changes not only in the various attempts by research
participants but also in the implementation of our methods (see an example of
the outcomes in the pictures below). Trying again is an option
that we as researchers were thankful for, and so were participants: for who
hasn’t in general had moments and situations where they have thought ‘this is
what I should have done’ or finished a conversation and after a while thought
‘Ah! This is what I should have replied!’
The interpretation of these
maps began along with their crafting, and has not finished. We still have some
work to do, including analyzing what these maps tell us about present views in
the context of other fieldwork material we gathered about past and future
perspectives of families’ social protection practices. We want to emphasize
that drawing their maps was something these participants enjoyed (and so did
we). Some of the pros discussed here—of the different attempts and on-site
conversations during the map-drawing becoming a resource—could also be
obtained in other contexts using computer software. But one thing to be said
about whatever means chosen is that networks can help visualize not only
quantities of flows but entire worldviews. And for the latter, thinking about the best
way of harnessing participants’ abilities is key for their engagement.
Our larger research work focuses on the deployment of mobile banking in changing practices of social protection for forcibly displaced families
in Colombia. Part of our research entailed drawing family maps of our
informants’ family practices of social protection. Methodologically, this
involved two steps: First, we mapped members of the network and in the second
step we mapped the different goods and services circulating within that network.
The goods and services included not only money but also care, food, housing, etc.
Here, we draw from our fieldwork experience to highlight
some of the interactions between research participants and researchers engaged
in the process.
We were interested in discovering the map drawing with our research participants in order to discuss different
aspects of the maps rather than assuming them beforehand. Networks
can be drawn using computer software which allow for homogeneity
of representations, ease of navigation for spatial arrangement and
rearrangement of nodes, and the possibility to build and manipulate layers of
information. However, using computers was an obstacle for our participants, so we chose
to work with hand drawn maps. Such a choice entailed a series of challenges and
findings that we share here.
During this and other research endeavors, we noticed various methods to which research participants were already accustomed: for instance, being asked
questions and their answers being recorded in paper or audio formats, and being asked
permission to take pictures or videos of them whilst they go about their
everyday lives. With these and other
methods however, the stages of design and analysis tend to be carried out elsewhere:
back home in researchers’ rooms or offices, discussing with colleagues or poring
over their notebooks or computers. As researchers, we take our time in formulating
problems, carefully crafting and often piloting approaches before we throw
ourselves into fieldwork. We also take considerable time in reflecting upon and
analyzing the information being explained. This can also be the case in mapping
social networks that are used primarily as a tool for the researcher to
interpret and convey her research findings. Our research departs somewhat from this model. Our approach encouraged an active
involvement of participants in the elucidation and visualization of their own
worldviews, as well as fostering an ongoing, joint reflection about findings.
The rationale for an approach that places the interaction of researchers and
research participants into central focus can be traced back to various
theoretical and ethical considerations. These include participatory action
research approaches giving prominence to the collective construction of
knowledge and highlighting the transformative aims of scholarship (Salazar,
1992; Fraser et.al, 2004) as well as an understanding of explanation as something that does not displace people’s experience (Smith, 1996). But this post
is less about our research methodology’s underpinnings and more about their
implications while mapping networks.

For the first step of mapping the members of the network we conceived of a set of conventions: circles for females and triangles for males,
double lines for marital unions and lines stemming from such unions conveying
offspring. The circle/triangle differentiation was easily incorporated by
research participants and perhaps showed how ingrained such
distinctions are. It was the other aspects of the exercise that presented difficulties.
For the first participant, we provided a sheet
of paper (size A2) and colors for drawing her map. In this, some hurdles came up with handling spatial
distribution: it so happened that either some members of the network ended up being cramped in a corner or
just did not fit within the page even as a large part of the page remained blank. In response to this we changed our strategy which proved useful. We provided participants with a large piece of
paper for practice so that they could get a feel of how the distribution
could look like (see picture below).

Other issues had less to do with practice and more to do with
fitting the realities of their networks into the picture: if a widow remarries
but keeps her connections with the family of her late husband, does she include
both mothers-in-law? How does one distinguish between formal unions and those
outside of marriage that have nonetheless produced offspring? What if a
neighbor or friend, who is not part of the family, is actually quite important
and ought to be included?
We are, however, left with the question of whether
these deviations stemming from reflections – as well as interactions between
the researchers and participants- are to be located within the metric of the problem or as a resource in itself. This is a real question, for which we don’t
have a set answer. If participant A in the example above aggregates types of
relationships, whilst participant B focuses on family units organized in terms
of couples and their offspring, this can affect both the sorts of flows being
drawn and the interpretation of them. In the case of B one can see how a
sibling with many children tends to receive more money than what he can give to
others, and this is not something that would be as evident in A’s map. But insisting
on the organization around family units could be an imposition on A, who may be
telling another story: one in which personal relations with a nephew, for
example, are not mediated by the sibling/parent but rely on
the relation or affinities between the two specific individuals.
Going back to the parallel with network-mapping computer software in
which centrality is provided by the flows in the network, in our research the
centrality of a node in the distribution was based on the person’s perception. Thus,
while the drawing of flows could eventually challenge the initial centrality
given to a node (´look how many things pass/ don’t pass through this person’),
this was not something that could be resolved by means of a straightforward formula. And this was so because we wanted to map different sorts of flows,
which do not necessarily have numerical equivalents. Let us move on to discuss,
then, the second step of our mapping exercises: the drawing of flows.
Arriving at the most relevant categories in research tends to be an
exercise of fine tuning between two poles that can be equally unproductive: too
much abstraction and too much complexity. Too much abstraction can empty the
map of the sort of referents that are meaningful for a person, or enforce the
invisibility of particular dimensions—which has happened often enough, particularly
when discussing the activities carried out in the domestic sphere. That too
much complexity can also be problematic was a lesson, which became all-too-evident
for us in this second part of the exercise. The design issues we faced in the
drawing of goods and services circulating through the network were, again, both
a matter of operational convenience and flexibility. For while including
different sorts of flows could give us a more comprehensive view of the
interactions in the network, too many flows could make the resulting map unreadable.
 |
| Sonia's fourth attempt, and her map with the money layer on top |
Fraser, N., H.
Dahl, P. Stolz and R. Willig (2004) ‘Recognition, redistribution and
representation in capitalist global society: An interview with Nacy Fraser’, Acta Sociológica, Vol.47, No.4,
pp.374-382.
Salazar, M.C. (1992) (editor) La investigación-acción participativa.
Inicios y Desarrollos. Editorial
Popular: Madrid, pp.14-20.
Smith,
D. (1996) ‘Telling the truth after postmodernism’, Symbolic Interaction, 19, pp.171-202.


